Dashboard
Introduction
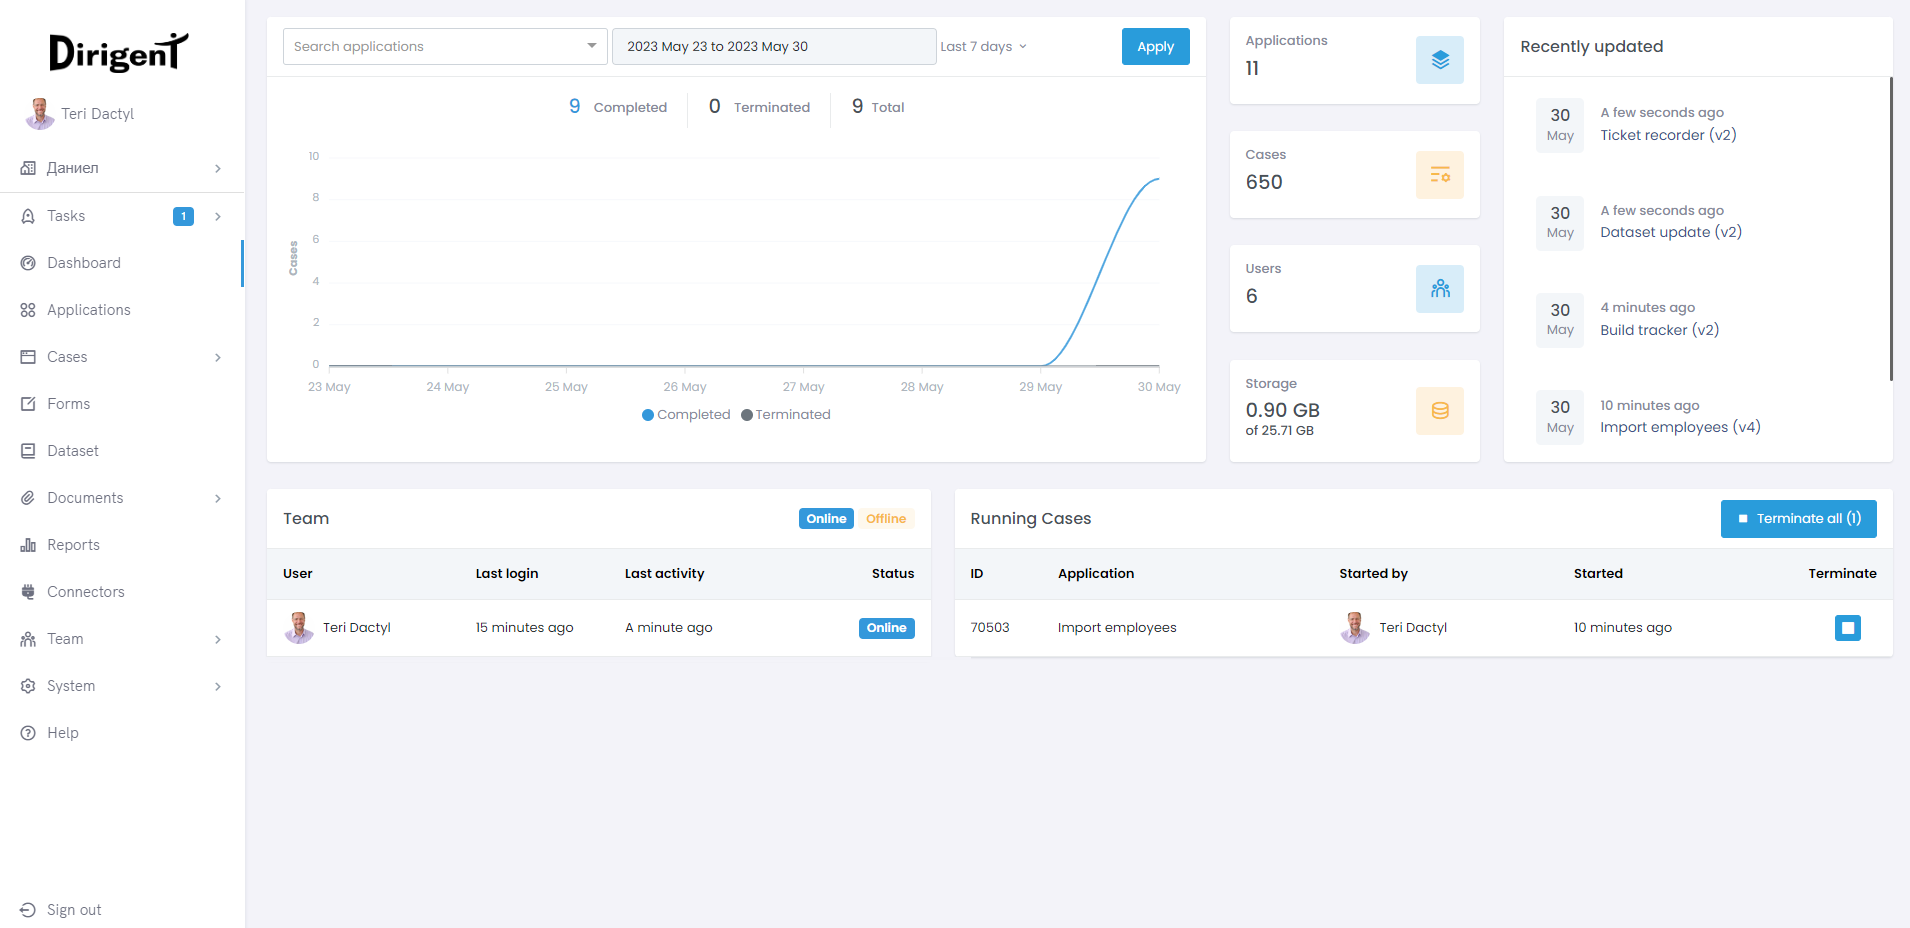
The Dashboard in Dirigent provides a comprehensive overview of the workspace's performance by presenting key elements, reporting statistics, history logs, and other relevant data. It serves as a centralized hub for users to access important information and make informed decisions. Here's an overview of the segments available on the Dashboard screen:
Application performace
The chart visually represents the performance statistics of applications over a selected period, such as the last three days, a week, a month, or a custom-defined timeframe. It also allows for the display of data for individual applications. The performance of applications is presented through various details, including the number of completed, terminated, and total cases (including the corresponding percentages), as well as the number of tasks.
Additionally, the chart provides information on case duration, including the minimum, maximum, and average durations, for the specified period. By clicking on any of these statistics, you can access a filtered list of cases that match the selected status
Are cases from the deleted applications included in the statistics?
Information about completed, terminated and total number of cases as well as their duration data is shown only for the existing applications.
Workspace storage
Workspace owners can see an additional summary widget on the right side of the screen, showing the number of applications, cases, users, and workspace storage used in GB.
Recently updated applications
Provides an overview of the latest 4 applications that were changed/updated by any user on your worskpace. You can see the name of the application, its current version, and time and date when the change took place. Clickin on the name of the application will lead you to its application screen.
Online/Offline Users
Shows when was the last activity of users in your workspace. Users currently active will be seen in the online section while the users not currently active will be placed in the offline section.
Running cases
This screen provides an overview of all currently running cases in the workspace. It provides some basic information such as the name of the application, when it was started and for long its been running. You can access the application or case screen by clicking on the application name (for application) or on the id (for the case). Running cases can be terminated from the dashboard either in bulk, by clicking the terminate all button, or individually with a terminate button placed on the left side of each running case.