Cases
Inroduction
Cases page is a collection of all cases that were executed in a particular workspace. A case is created when an application is in the running state, meaning that every run of an application creates a new case that showcases each step that the application took in its execution together with all other relevant data.
Cases page
On the top of the cases page, you can search through cases as well as use advanced filters so you can browse cases by multiple different criteria. Apply any combination of filters you want and get a list of requested cases that match your filter selection. Terminate all button is also located there, making the termination of multiple cases easy. Some elements on the Cases page can be clicked to gain further insight in the execution, such as application and document.
Delete a case
A case can be deleted by ticking the checkbox and clicking the Delete button. Alternatively, a case can be deleted by clicking on the case, and then from the individual case page, click the Delete button.
Running cases cannot be deleted
Terminate a case
Case can be terminated in a number of ways. From the Dashboard, from the application page, from the cases page, etc. Individual cases can be terminated by clicking the Terminate button that will appear at every running case. If there is too many cases to terminate individualy, a Terminate all button is also present which will terminate all processes that are currently active.
Case page
On the Cases page of Dirigen, click on the ID of the case you want to inspect to access a variety of detailed information regarding that particular case such as name, id, status, etc. Process preview is also present on the case's page showing you how to execution flow went. Process preview here consists from three parts,1. Preview, 2. Steps, and 3. Inspector.
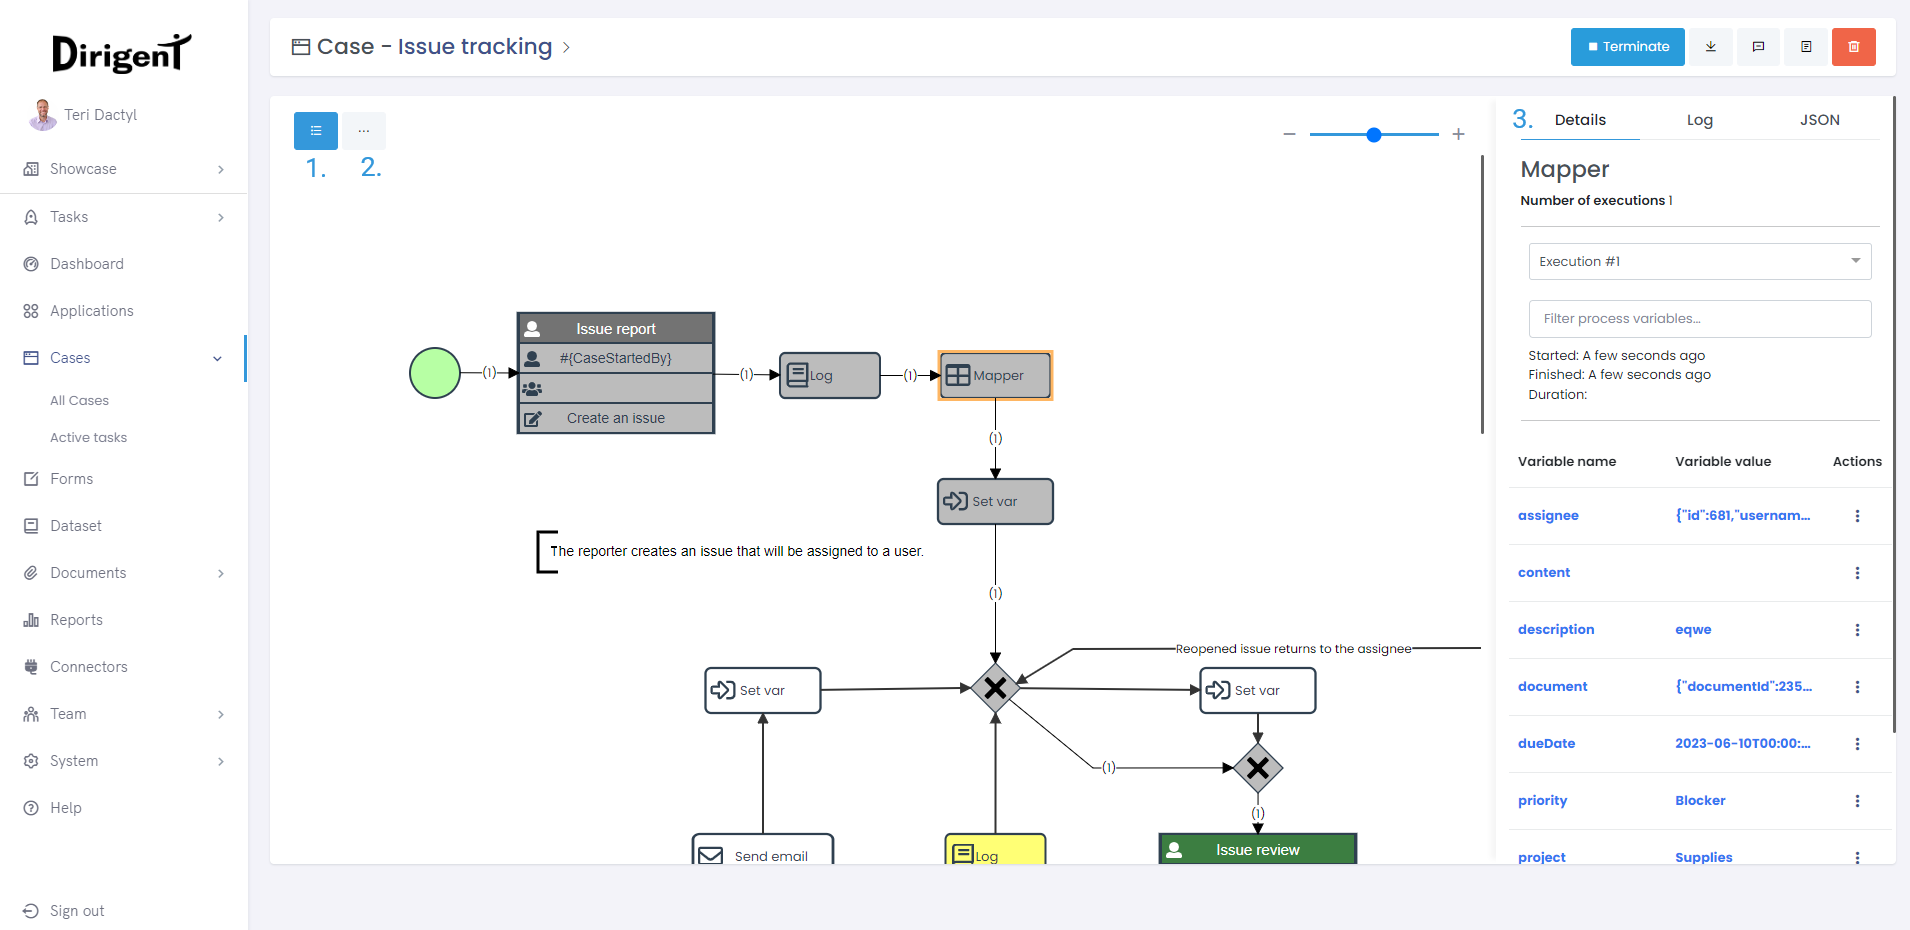
Preview
This is where the case execution can be tracked both when the case is active or after it's done using the Case Preview. When taking a look at the preview, tasks can be colored in either:
- Gray - The task has been completed.
- Green - The task is currently in progress.
As the application progresses between the tasks, a number will be added on the connections for every time application went trough them, including multiple passes using the same connection indicating how many times the application passed through this connection. To see the state and values of the process variables that were in use, simply click on a desired completed task, and a small sidewindow named "Task executions" will pop up on the right side.
What is a process variable?
A process variable is a variable that can be seen and used by any task throughout the application. The value of a process variable seen within a task execution shows the state of the process variable at the moment the application entered this task. A variable consists of its name, which is used in order to reference the variable within the process, and it's value.
Steps
Case Step Line section will, step by step, guide you through the case's execution, from it's beginning all the way until the end. Unlike in Case Preview, you can't click on the elements while in Case Step Line. Instead, you will use the navigation bar located just above the case preview. On the left and the right side of the navigation bar are located movement buttons that will allow you to move back and forth through the case with ease.
In each step, the connection that is leading to the task you are looking at will be colored green while the task you are currently looking at will be colored green with an orange border. Case Step Line will also increment the number on the connections to reflect how many times execution passed trough, as well as offer the Tasks Execution window with all of its functionalities as Case Preview except for the JSON tab. Process variables will change color based on their state at the current task that is being viewed:
- Green - Process variable is new.
- Blue - Process variable has changed.
- Black - Process variable has not changed.
Inspector
Inspector is the place where variables can be tracked trhough the process execution. It enables users to search for variables, see multiple executions, as well as preview or copy the variable value. It consists out of three parts, Details, Log, and JSON. To open the inspector, just click on any task.
Details
This tab offers an overview of the variables that were used in the process. Execution dropdown servers the purpouse of enabling the user to look at other executions if the process path went trough the task more than once. Variables can be filtered to look only for the ones relevant to you.
Variables consist of name and value which are colored depending on the their status: Unchanged, Changed, and New. There is an action menu which enables you to either copy the variable value, or take a look at it fully. This is especially useful for JSON responses since the preview is formatted.
Log
Business log is a place where you can see a list of all actions executed in the course of the running case that can be navigated by using buttons for up and down movement. Comments can also be left in the log so you can convey any messages or questions you may have regarding the execution.
If you want even more details, you can always access the full log view by clicking on View business log button. Action menu is present, offering you the options to either preview the log message fully, or to copy its concent.
JSON
This tab offers the formated JSON of the selected task that can be downloaded or copied.